Tableau Bitesize: Progress To Target - Bullet Chart
- James Goodall

- Jan 8, 2021
- 2 min read
This post details how to create a bullet chart from scratch

The Tableau experts among you may be aware that the bullet chart is actually one of those that’s available via the ‘Show Me’ function, but I thought it’d be useful (for me anyway) to go through creating one from scratch
This chart type, unlike the others, is a very useful way of displaying values that might exceed 100%
This, together with the other blog posts in the ‘Progress to Target’ series will use the ‘progress_dummy_data.csv’ file attached below:
This file contains dummy data related to 5 teams – it has just 3 columns: ‘ID’, ‘Team Name’, and ‘Target Met’ and is therefore recording which teams have met their particular (generic) target
As with the other blog posts, start off by creating a parameter from the ‘Team Name’ field:


Next, create a calculated field called ‘Team Filter’ as follows:
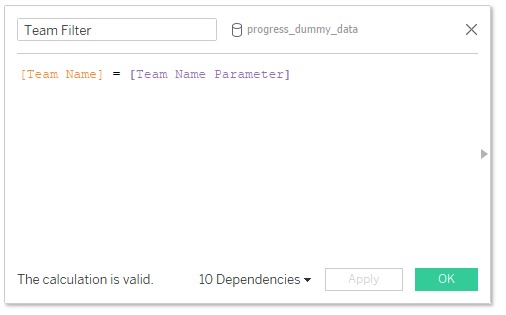
[Team Name] = [Team Name Parameter]
Then drag this to the Filters card and select ‘True’

You can then choose a team from the list of parameters – in this example I will be using ‘team_3’
To begin with, let’s create the fields we will need to build this chart
1

MIN(1)
‘Total Met Target’:

SUM(IIF([Met Target],1,0))
This one simply records a ‘1’ value whenever the team has a TRUE value for the ‘Met Target’ field which we can then use to calculate the %
% Met Target

[Total Met Target] / COUNT([progress_dummy_data.csv])
Now the fun can start!
Drag the ‘% Met Target’ field onto the columns shelf and the ‘1’ field onto the ‘Details’ shelf
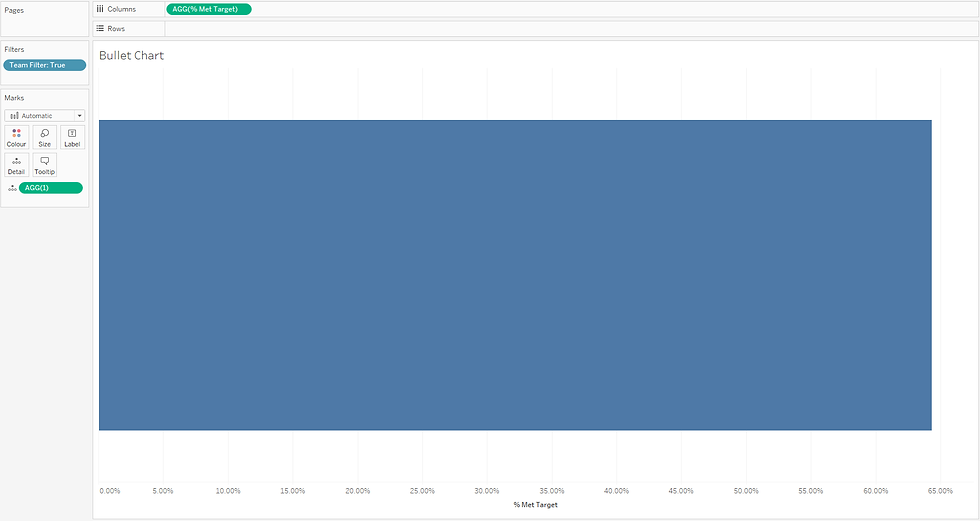
In this case the ‘1’ field will be our target (100%)
Click on the ‘Analytics’ tab, then drag a Reference Line onto the view for the table

Set the reference line up as follows

And your view should look like this

Next, we want to create the shaded values behind which will act as our indicators of progress (e.g. 60% of target, 80% of target etc)
Again, on the ‘Analytics’ tab, drag a ‘Reference Band’ onto the view for the table

Set this band up as follows


Note this is creating a band that will span 0% to 60% of the Total of the target field (1)
Next, repeat the process by dragging another reference band onto the view, but this time set it up as 60 – 80 % and with a slightly different fill (I went for a lighter grey)

Remove the lines (except reference line!!) & borders and hide the headers and it should look something like this

This looks a little weird with the bars being so wide, but when this sits on a dashboard and the height of the container is reduced, it looks much more like what we would expect
And there you go – a bullet chart without using the ‘Show Me’ function!
I hope you found this useful but if you have any questions – please feel free to leave a comment below!
The workbook on Tableau Public below contains all of the chart types used in the ‘Progress to Target’ series, including this one


Comments