Tableau Bitesize: Dynamically Change Bin Sizes
- James Goodall

- May 9, 2023
- 3 min read
Recently, I was completing some work analysing journey times and costs, and discovered that I needed to show the distribution of values across different ticket types (single, weekly, monthly and yearly), however, the range of values within those ticket types varied quite widely, and so when using a basic histogram, the values of the bins needed to change each time I switched between the ticket types.
I could have built a number of different histograms, each with different bin sizes, but I wanted to see if I could dynamically change the size of a bin, based on a discrete string dimension value, and it turns out….yes I could, and so I thought I’d share how I completed this in the hope that this might be useful to someone else!

To find out how I built this dashboard, follow the steps detailed below
I can’t share the original data source I was looking at so I have mocked up some data around travel costs which you can download below
To start with, connect to the data source
To switch between the different ticket types, I wanted some buttons on the dashboard, with a view to using parameter actions to filter and highlight. To create the buttons, create a new sheet called ‘Ticket Type Buttons’ then drag the ‘Ticket Type’ dimension onto the Rows, change the Mark Type to Circle, add labels and format / size to your choosing

Next, create a parameter from the ‘Ticket Type’ dimension and call it ‘Ticket Type Parameter’


Create a Calculated Field called ‘Ticket Type Highlight’ as follows:

[Ticket Type] = [Ticket Type Parameter]
Drag this onto the ‘Colour’ mark and format to your choosing

Now on to the Histogram
Create a new sheet called ‘Histogram’, then create a new Parameter called ‘Bin Size Parameter’ set up as follows

Right click on the ‘Cost’ Measure and select ‘Create -> Bins’

For the ‘Size of bins’ value, change this to ‘Bins Size Parameter’

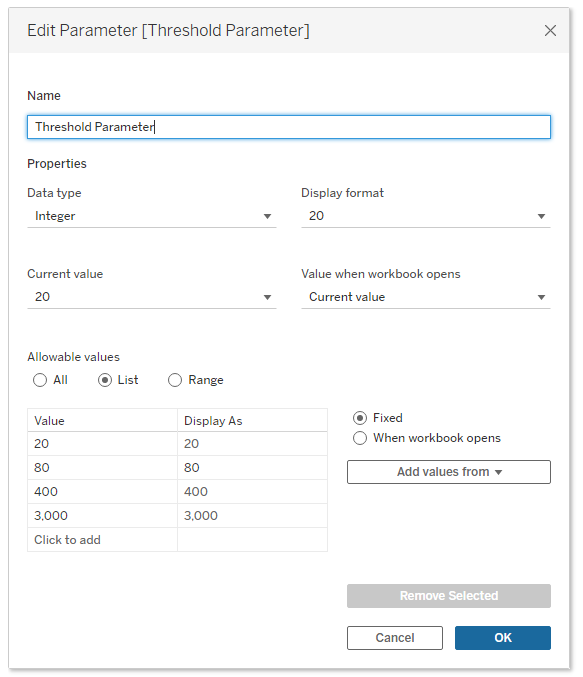
Create another parameter called ‘Threshold Parameter’ set up as follows
Then, create a calculated field called ‘Below Threshold?’ set up as below

[Cost] <= [Threshold Parameter]
To create the chart, first add the ‘Ticket Type Highlight’ calculated field to the Filters card and set this as ‘True’, drag the ‘Cost (bin)’ field onto Columns (as continuous), a distinct count of the ‘Id’ field to the Rows, then the ‘Below Threshold?’ calculated field onto colour and format to your choosing

I also created sheets for ‘Average Cost’, ‘Highest Cost’ and ‘Lowest Cost’ set as AVG([Cost]), MAX([Cost]) and MIN([Cost]), again with the ‘Ticket Type Highlight’ field added to the Filter card and set to ‘True’
I also created a Donut chart to show the % values within the thresholds and another chart to show the values – I won’t explain how to create those in this post, as it’s not relevant to the functionality around changing the bin sizes, but you can download the workbook if you want to see how these were constructed
OK, on to setting the bin sizes
Jump back to the ‘Ticket Type Buttons’ sheet and create the following calculated fields:
Bin Size

IF [Ticket Type] = 'daily' THEN {FIXED:MIN(5)}
ELSEIF [Ticket Type] = 'weekly' THEN {FIXED:MIN(20)}
ELSEIF [Ticket Type] = 'monthly' THEN {FIXED:MIN(100)}
ELSEIF [Ticket Type] = 'yearly' THEN {FIXED:MIN(500)}
END
-----------
Threshold Value

IF [Ticket Type] = 'daily' THEN {FIXED:MIN(20)}
ELSEIF [Ticket Type] = 'weekly' THEN {FIXED:MIN(80)}
ELSEIF [Ticket Type] = 'monthly' THEN {FIXED:MIN(400)}
ELSEIF [Ticket Type] = 'yearly' THEN {FIXED:MIN(3000)}
END
Drag these 2 fields onto the ‘Detail’ mark (both as a Dimension)

Now we can create our dashboard. Drag all of the sheets you’ve created onto the dashboard and arrange them / format to your choosing (note I’ve also added a ‘Journey Type’ filter here applied to all sheets)

Now’s where we set the functionality up
Click on ‘Dashboard -> Actions’
Click ‘Add Action -> Change Parameter’, called it ‘Ticket Type Parameter’ and set it up as follows:

This parameter action will serve to change the value of the ‘Ticket Type Parameter’ parameter which will filter the charts and change the highlighting as appropriate
Add another Parameter Action (‘Add Action -> Change Parameter’), call it ‘Bin Size Parameter’ and set it up as follows:

This will add the relevant value that we specified in the calculated field above into the ‘Bin Size Parameter’ parameter when we click on the relevant Ticket Type value
Add another Parameter Action (‘Add Action -> Change Parameter’), call it ‘Threshold Parameter’ and set it up as follows:

This action will set the threshold value depending on which ticket type is selected
And that’s all there is to it – we have an interactive dashboard that will change bin sizes and threshold values depending on the value of a discrete dimension
I hope you find this helpful!


Comments